| For Immediate Release:
September 22, 2003 |
Contact: Craig McDonald, Andrew Wheat
512-472-9770 |
Texas Lawmakers Go Out of District
For 75 Percent of All Campaign Dollars
|
|||||||||||||||||||||||||||||||||||||||||||||
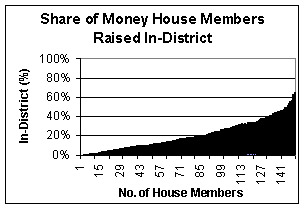
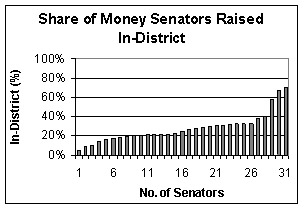
Texans who lack a voice in the capitol will not be shocked to learn that 95 percent of our lawmakers go outside their home districts for most of their campaign money, said Texans for Public Justice Director Craig McDonald. This system has two classes of constituentsthose who vote and those who pay for the campaigns. Those who pay get the access.
Just six Representatives (4 percent of the House) and three Senators (10 percent of that chamber) raised more than half of their money in-district. Yet one in four lawmakers (two Senators and 43 Representatives) raised more than 90 percent of their money outside their home district. Rep. Miguel Wise, D-Weslaco, did not report a single in-district contribution. The contributions of Rep. Kevin Bailey, D-Houston, could not be analyzed becausein violation of state lawhe failed to report his donors zip codes. Five other House members (including House Speaker Tom Craddick and predecessor Pete Laney) raised just 1 percent of their money in-district.
The zip codes of just 10 business districts in Austin, Houston, Dallas and Fort Worth accounted for $15,414,628 or 36 percent of all lawmaker money. In fact, Austins premiere lobby zip code, 78701, accounted for $8,142,524 19 percent of all the money that lawmakers raised.
Given the power of the Austin lobby, it is not surprising that the two lawmakers who raised the greatest share of money in-district represent lucrative central Austin districts. Austin Sen. Gonzalo Barrientos, D, raised 70 percent of his money in-district, while 65 percent of Democratic Rep. Elliott Naishtats money came from his Austin district.
In the House, Republicans got 22 percent of their money in-district compared to 20 percent for House Democrats. In the Senate, in-district money accounted for 29 percent of all Republican money and 34 percent of Democratic money.
The analysis applied here grants legislators the benefit of the doubt.
If any part of a zip code fell within a lawmakers district, every donation
from that zip code was treated as in-district. For in-district figures
on every Texas lawmaker, see http://www.tpj.org/press_releases/outofdistrict_append.html
analyzed because he failed to report donor zip codes. |
|
| Recipient | Party | Dis-
trict |
All Money
Raised |
In-District
Money |
Percentage
In-District |
| Armbrister, Kenneth | D | 18 | $539,094 | $92,100 | 17% |
| Averitt, Kip | R | 22 | $1,085,347 | $352,740 | 33% |
| Barrientos, Gonzalo | D | 14 | $1,067,283 | $742,893 | 70% |
| Bivins, Teel | R | 31 | $451,700 | $301,120 | 67% |
| Brimer, Kenneth | R | 10 | $725,860 | $135,934 | 19% |
| Carona, John J. | R | 16 | $648,807 | $174,452 | 27% |
| Deuell, Robert F. | R | 02 | $1,056,661 | $50,444 | 05% |
| Duncan, Robert L. | R | 28 | $332,335 | $87,850 | 26% |
| Ellis, Rodney G. | D | 13 | $472,155 | $150,150 | 32% |
| Estes, Craig | R | 30 | $1,110,678 | $424,912 | 38% |
| Fraser, Troy | R | 24 | $502,480 | $160,633 | 32% |
| Gallegos, Mario V. | D | 06 | $244,638 | $50,775 | 21% |
| Harris, Chris | R | 09 | $317,661 | $45,986 | 14% |
| Hinojosa, Juan | D | 20 | $1,014,123 | $410,408 | 40% |
| Jackson, James M. | R | 11 | $246,534 | $25,330 | 10% |
| Janek, Kyle | R | 17 | $1,088,416 | $218,235 | 20% |
| Lindsay, Jon S. | R | 07 | $170,775 | $38,000 | 22% |
| Lucio, Eduardo A. | D | 27 | $328,073 | $52,142 | 16% |
| Madla, Frank | D | 19 | $331,351 | $29,100 | 09% |
| Nelson, Jane | R | 12 | $534,111 | $112,995 | 21% |
| Ogden, Stephen E. | R | 05 | $251,773 | $46,400 | 18% |
| Ratliff, William R. | R | 01 | $557,655 | $135,601 | 24% |
| Shapiro, Florence | R | 08 | $492,497 | $147,893 | 30% |
| Shapleigh, Eliot G. | D | 29 | $292,154 | $84,555 | 29% |
| Staples, Todd | R | 03 | $346,992 | $113,576 | 33% |
| Van De Putte, Leticia | D | 26 | $354,143 | $72,235 | 20% |
| Wentworth, E. Jeffrey | R | 25 | $1,125,451 | $647,351 | 58% |
| West, Royce | D | 23 | $404,708 | $122,948 | 30% |
| Whitmire, John | D | 15 | $440,325 | $92,250 | 21% |
| Williams, Thomas D. | R | 04 | $917,386 | $195,091 | 21% |
| Zaffirini, Judith | D | 21 | $395,775 | $112,996 | 29% |
| TOTALS: | $17,846,941 | $5,427,095 | 30% |
| Recipient | Party | District | All Money
Raised |
In-District
Money |
Percentage
In-District |
| Allen, Robert R. | R | 106 | $87,685 | $3,610 | 04% |
| Alonzo, Roberto R. | D | 104 | $90,400 | $14,475 | 16% |
| Bailey, Kevin E. | D | 140 | $138,444 | *Unknown | *Unknown |
| Baxter, Todd A. | R | 048 | $514,849 | $208,347 | 40% |
| Berman, Leo | R | 006 | $26,875 | $5,300 | 20% |
| Bohac, Dwayne A. | R | 138 | $311,409 | $55,341 | 18% |
| Bonnen, Dennis H. | R | 025 | $79,388 | $8,913 | 11% |
| Branch, Daniel H. | R | 108 | $419,032 | $262,754 | 63% |
| Brown, Betty J. | R | 004 | $182,874 | $32,329 | 18% |
| Brown, Frederick H. | R | 014 | $111,920 | $37,920 | 34% |
| Burnam, Lon | D | 090 | $115,104 | $32,550 | 28% |
| Callegari, William A. | R | 132 | $117,929 | $10,100 | 09% |
| Campbell, Scott E. | R | 072 | $134,404 | $43,341 | 32% |
| Canales, Gabriella S. | D | 035 | $71,843 | $13,732 | 19% |
| Capelo, Jaime L. | D | 034 | $265,196 | $119,151 | 45% |
| Casteel, Carter | R | 073 | $291,141 | $150,856 | 52% |
| Castro, Joaquin | D | 125 | $159,643 | $19,958 | 13% |
| Chavez, Norma P. | D | 076 | $90,127 | $18,377 | 20% |
| Chisum, Warren D. | R | 088 | $163,883 | $6,300 | 04% |
| Christian, Walter W. | R | 009 | $226,810 | $67,291 | 30% |
| Clark, Ronald H. | R | 062 | $21,300 | $8,200 | 38% |
| Coleman, Garnet F. | D | 147 | $149,075 | $35,300 | 24% |
| Cook, Byron Curtis | R | 008 | $287,096 | $95,362 | 33% |
| Cook, Robert L. | D | 017 | $170,617 | $29,475 | 17% |
| Corte, Frank J. | R | 122 | $121,617 | $37,417 | 31% |
| Crabb, Joe | R | 127 | $97,701 | $11,101 | 11% |
| Craddick, Tom | R | 082 | $1,095,536 | $13,800 | 01% |
| Crownover, Myra E. | R | 064 | $73,186 | $34,450 | 47% |
| Davis, John E. | R | 129 | $84,103 | $15,470 | 18% |
| Davis, Yvonne | D | 111 | $70,316 | $4,615 | 07% |
| Dawson, Glenda L. | R | 029 | $224,656 | $43,155 | 19% |
| Delisi, Dianne W. | R | 055 | $110,825 | $21,250 | 19% |
| Denny, Mary | R | 063 | $103,375 | $7,350 | 07% |
| Deshotel, Joseph D. | D | 022 | $43,780 | $10,480 | 24% |
| Driver, Joe | R | 113 | $105,640 | $12,700 | 12% |
| Dukes, Dawnna | D | 046 | $78,217 | $4,950 | 06% |
| Dunnam, James R. | D | 057 | $188,340 | $76,615 | 41% |
| Dutton, Harold V. | D | 142 | $61,250 | $1,000 | 02% |
| Edwards, Al | D | 146 | $49,975 | $5,075 | 10% |
| Eiland, Craig | D | 023 | $142,539 | $38,700 | 27% |
| Eissler, Rob | R | 015 | $182,365 | $89,434 | 49% |
| Elkins, Gary | R | 135 | $83,151 | $5,000 | 06% |
| Ellis, Daniel P. | D | 018 | $167,763 | $16,500 | 10% |
| Farabee, David L. | D | 069 | $111,902 | $30,714 | 27% |
| Farrar, Jessica | D | 148 | $93,327 | $16,255 | 17% |
| Flores, Ismael "Kino" | D | 036 | $60,365 | $33,543 | 56% |
| Flynn, Dan | R | 002 | $238,266 | $51,196 | 21% |
| Gallego, Pete P. | D | 074 | $245,019 | $44,234 | 18% |
| Garza, Timoteo | D | 080 | $41,800 | $700 | 02% |
| Gattis, Dan | R | 020 | $135,975 | $17,050 | 13% |
| Giddings, Helen | D | 109 | $108,275 | $9,350 | 09% |
| Goodman, Toby | R | 093 | $142,157 | $6,710 | 05% |
| Goolsby, Tony | R | 102 | $93,986 | $7,950 | 08% |
| Griggs, Bob E. | R | 091 | $80,181 | $23,804 | 30% |
| Grusendorf, Kent | R | 094 | $94,860 | $2,310 | 02% |
| Guillen, Ryan A. | D | 031 | $29,074 | $5,000 | 17% |
| Gutierrez, Roberto | D | 041 | $12,675 | $4,900 | 39% |
| Haggerty, Patrick B. | R | 078 | $41,505 | $13,855 | 33% |
| Hamilton, Michael W. | R | 019 | $263,091 | $25,497 | 10% |
| Hamric, Peggy | R | 126 | $97,925 | $9,100 | 09% |
| Hardcastle, Richard L. | R | 068 | $282,653 | $48,167 | 17% |
| Harper-Brown, Linda L. | R | 105 | $123,206 | $32,591 | 26% |
| Hartnett, Will | R | 114 | $39,135 | $6,384 | 16% |
| Heflin, Talmadge L. | R | 149 | $369,542 | $13,990 | 04% |
| Hegar, Glenn A. | R | 028 | $123,666 | $46,881 | 38% |
| Hilderbran, Harvey R. | R | 053 | $117,870 | $37,200 | 32% |
| Hill, Fred | R | 112 | $48,270 | $2,475 | 05% |
| Hochberg, Lindsey S. | D | 137 | $203,396 | $14,790 | 07% |
| Hodge, Gladys E. | D | 100 | $70,850 | $15,800 | 22% |
| Homer, Mark S. | D | 003 | $38,350 | $13,200 | 34% |
| Hope, Ruben | R | 016 | $146,035 | $49,147 | 34% |
| Hopson, Charles L. | D | 011 | $169,540 | $67,015 | 40% |
| Howard, Charles F. | R | 026 | $44,350 | $6,100 | 14% |
| Hughes, D. Bryan | R | 005 | $213,064 | $26,535 | 12% |
| Hunter, Bob | R | 071 | $112,025 | $46,500 | 42% |
| Hupp, Suzanna G. | R | 054 | $37,537 | $2,850 | 08% |
| Isett, Carl H. | R | 084 | $120,496 | $49,546 | 41% |
| Jones, Delwin | R | 083 | $135,220 | $60,212 | 45% |
| Jones, Elizabeth A. | R | 121 | $236,025 | $117,425 | 50% |
| Jones, Jesse W. | D | 110 | $54,100 | $5,450 | 10% |
| Keel, Terrence M. | R | 047 | $146,935 | $21,475 | 15% |
| Keffer, James L. | R | 060 | $149,350 | $49,667 | 33% |
| Keffer, William R. | R | 107 | $143,613 | $18,467 | 13% |
| King, Phillip S. | R | 061 | $224,369 | $96,867 | 43% |
| Kolkhorst, Lois W. | R | 013 | $63,546 | $1,000 | 02% |
| Krusee, Michael | R | 052 | $115,837 | $8,288 | 07% |
| Kuempel, Edmund P. | R | 044 | $255,836 | $24,566 | 10% |
| Laney, James E. | D | 085 | $832,176 | $10,350 | 01% |
| Laubenberg, Jodie A. | R | 089 | $168,885 | $18,060 | 11% |
| Lewis, Glenn O. | D | 095 | $49,188 | $4,950 | 10% |
| Luna, Vilma | D | 033 | $151,743 | $37,500 | 25% |
| Mabry, John P. | D | 056 | $219,339 | $100,238 | 46% |
| Madden, Jerry A. | R | 067 | $145,736 | $21,660 | 15% |
| Marchant, Kenny E. | R | 115 | $201,072 | $12,322 | 06% |
| Martinez Fischer, Trey | D | 116 | $117,578 | $11,650 | 10% |
| McCall, James B. | R | 066 | $274,812 | $26,030 | 09% |
| McClendon, Ruth J. | D | 120 | $117,704 | $32,534 | 28% |
| McReynolds, James M. | D | 012 | $171,447 | $40,329 | 24% |
| Menendez, Jose | D | 124 | $129,509 | $4,800 | 04% |
| Mercer, Kenneth B. | R | 117 | $195,242 | $37,281 | 19% |
| Merritt, Thomas C. | R | 007 | $165,455 | $59,815 | 36% |
| Miller, Sidney C. | R | 059 | $363,262 | $49,904 | 14% |
| Moreno, Joe E. | D | 143 | $137,173 | $4,500 | 03% |
| Moreno, Paul | D | 077 | $86,014 | $11,750 | 14% |
| Morrison, Geanie W. | R | 030 | $96,155 | $51,755 | 54% |
| Mowery, Anna | R | 097 | $48,375 | $18,175 | 38% |
| Naishtat, Elliott | D | 049 | $111,480 | $72,440 | 65% |
| Nixon, Joe | R | 133 | $52,290 | $850 | 02% |
| Noriega, Richard J. | D | 145 | $72,425 | $3,550 | 05% |
| Oliveira, Rene O. | D | 037 | $128,036 | $28,550 | 22% |
| Olivo, Dora F. | D | 027 | $76,401 | $11,839 | 15% |
| Paxton, W. Kenneth | R | 070 | $198,060 | $49,505 | 25% |
| Pena, Aaron | D | 040 | $61,950 | $16,900 | 27% |
| Pickett, Joseph C. | D | 079 | $90,799 | $15,350 | 17% |
| Pitts, James R. | R | 010 | $180,354 | $58,106 | 32% |
| Puente, Robert R. | D | 119 | $98,201 | $800 | 01% |
| Quintanilla, Inocente | D | 075 | $75,197 | $19,441 | 26% |
| Rangel, Irma | D | 043 | $144,048 | $7,700 | 05% |
| Raymond, Richard E. | D | 042 | $442,898 | $203,751 | 46% |
| Reyna, Elvira | R | 101 | $11,550 | $3,050 | 26% |
| Riddle, Deborah A. | R | 150 | $95,495 | $9,750 | 10% |
| Ritter, Allan B. | D | 021 | $253,808 | $90,585 | 36% |
| Rodriguez, Eduardo R. | D | 051 | $93,001 | $52,993 | 57% |
| Rose, Patrick | D | 045 | $540,502 | $170,227 | 31% |
| Seaman, Eugene J. | R | 032 | $378,033 | $90,535 | 24% |
| Smith, Richard Wayne | R | 128 | $189,441 | $12,950 | 07% |
| Smith, Todd A. | R | 092 | $66,155 | $12,850 | 19% |
| Smithee, John T. | R | 086 | $44,870 | $5,350 | 12% |
| Solis, Jim | D | 038 | $181,255 | $61,755 | 34% |
| Solomons, Burt | R | 065 | $199,801 | $6,850 | 03% |
| Stick, Jack | R | 050 | $315,450 | $38,192 | 12% |
| Swinford, David A. | R | 087 | $247,076 | $80,825 | 33% |
| Talton, Robert E. | R | 144 | $93,791 | $17,631 | 19% |
| Taylor, Larry | R | 024 | $299,097 | $45,836 | 15% |
| Telford, Barry B. | D | 001 | $240,592 | $44,350 | 18% |
| Thompson, Senfronia | D | 141 | $251,075 | $2,550 | 01% |
| Truitt, Vicki | R | 098 | $155,597 | $72,327 | 46% |
| Turner, Sylvester | D | 139 | $552,837 | $48,000 | 09% |
| Uresti, Carlos I. | D | 118 | $76,969 | $1,550 | 02% |
| Van Arsdale, J. Corbin | R | 130 | $96,285 | $12,510 | 13% |
| Villarreal, Michael U. | D | 123 | $161,297 | $72,600 | 45% |
| West, G. E. | R | 081 | $83,652 | $20,275 | 24% |
| Wilson, Ron | D | 131 | $52,700 | $300 | 01% |
| Wise, Miguel D. | D | 039 | $48,950 | $0 | 00% |
| Wohlgemuth, Arlene | R | 058 | $205,705 | $38,420 | 19% |
| Wolens, Steven D. | D | 103 | $363,630 | $29,210 | 08% |
| Wong, Martha J. | R | 134 | $611,934 | $186,599 | 30% |
| Woolley, Beverly | R | 136 | $38,950 | $4,000 | 10% |
| Zedler, William W. | R | 096 | $57,060 | $7,278 | 13% |
| TOTALS: | $24,662,175 | $5,280,303 | 21% |
# # #
Texans for Public Justice is a non-profit, non-partisan research
and advocacy
organization that tracks the role of money in Texas politics.
home | press releases |